
RS Aggarwal Quantitative Aptitude PDF Free Download: LINE-GRAPHS
LINE-GRAPHS
This section comprises of question in which the data collected in a particular discipline
are represented by specific points together by straight lines. The points are plotted on a two-dimensional plane taking one parameter on the horizontal axis and the other on the vertical axis. The candidate is required to analyse the given information and thereafter answer the given questions on the basis of the analysis of data.
SOLVED EXAMPLES
Ex. 1. In a school the periodical examination are held every second month. In a session during Apr. 2001 – Mar. 2002, a student of Class IX appeared for each of the periodical exams. The aggregate marks obtained by him in each periodical exam are represented in the line-graph given below. Study the graph and answer the questions based on it. (S.B.I.P.O 2003)
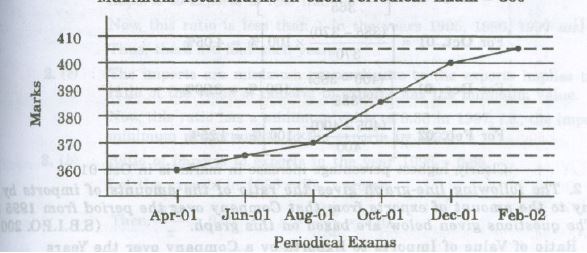
MARKS OBTAINED BY A STUDENT IN SIX PERIODICAL EXAMS HELD IN
EVERY TWO MONTHS DURING THE YEAR IN THE SESSION 2001-02
Maximum Total Marks In each Periodical Exam = 500
The total number of marks obtained in Feb. 02 is what percent of the total marks obtained in Apr. 01?
(a) 110% (b) 112.5% (c) 115% (d) 116.5% (e) 117.5%
- What are the average marks obtained by the student in all the periodical exams of during the session.
(a) 373 (b) 379 (c) 381 (d) 385 (e) 389
- what is the percentage of marks obtained by the student in the periodical exams of Aug. 01 and Oct. 01 taken together?
(a) 73.25% (b) 75.5% (c) 77% (d) 78.75% (e) 79.5%
- In which periodical exams there is a fall in percentage of marks as compared to the previous periodical exams?
(a) None (b) Jun. 01 (c) Oct. 01 (d) Feb. 01 (e) None of these
- In which periodical exams did the student obtain the highest percentage increase in marks over the previous periodical exams?
(a) Jun. 01 (b) Aug. 01 (c) Oct. 01 (d) Dec. 01 (e) Feb. 02
Sol. Here it is clear from the graph that the student obtained 360, 365, 370, 385, 400 and 405 marks in periodical exams held in Apr. 01, Jun. 01, Aug. 01, Oct. 01, Dec. 01 and Feb. 02 respectively.
- (b) : Required percentage = [(405/360)*100] % = 112.5 %
- (c) : Average marks obtained in all the periodical exams.
= (1/6)*[360+370+385+400+404] = 380.83 » 381.
- (d) : Required percentage = [(370+385)/(500+500) * 100] % = [(755/1000)*100]% =75.5%
- (a) : As is clear from graph, the total marks obtained in periodical exams, go on increasing. Since, the maximum marks for all the periodical exams are same , it implies that the percentage of marks also goes on increasing. Thus, in none of the periodical exams, there is a fall in percentage of marks compared to the previous exam.
- (c) : Percentage increases in marks in various periodical exams compared to the previous exams are:
For Jun. 01 = [(365-360)/360 * 100 ] % = 1.39 %
For Aug. 01 = [(370-365)/365 * 100 ] % = 1.37 %
For Oct. 01 = [(385-370)/370 * 100 ] % = 4.05%
For Dec. 01 = [(400-385)/385 * 100 ] % = 3.90 %
For Feb. 02 = [(405-400)/400 * 100 ] % = 1.25 %
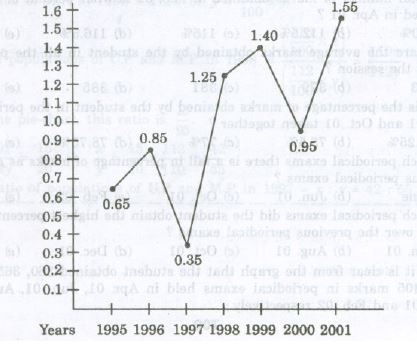
Ex. 2. The following line- graph the ratio of the amounts of imports by a Company to the amount of exports from that Company over the period from 1995 to 2001. The questions given below are based on this graph. (S.B.I.P.O 2001)
Ratio of value of Import to Export by a Company over the Years
In how many of the given years were the exports more than the imports?
- 1 b. 2 c. 3 d. 4
2.The imports were minimum proportionate to the exports of the Company in the year:
a..1995 b.1996 c.1997 d.2001
3.If the imports of the Company in 1996 was Rs.272 crores, the exports from the Company in 1996 was:
- Rs.370 crores b.Rs.320 crores c.Rs.280 crores
d.Rs.275 crores e.Rs.264 crores
4.What was the percentage increase in imports from 1997 to 1998?
- 72 b.56 c.28 d.None of these e.Data inadequate
5.If the imports in 1998 was Rs.250 crores and the total exports in the years 1998 and 1999 together was Rs.500 crores, then the imports in 1999 was:
a.Rs.250 crores b.Rs.300 crores c.Rs 357 crores
d.Rs 420 crores e.None of these
Sol: 1. d : The exports are more than the imports implies that the ratio of value of imports to exports is less than 1.
Now, this ratio is less than 1 in the years 1995,1996,1997 and 2000.
Thus, there are four such years.
- c: The imports are minimum proportionate to the exports implies that the ratio of the value of imports to exports has the minimum value.
Now, this ratio has a minimum value of 0.35 in 1997, i.e., the imports are minimum proportionate to the exports in 1997.
- b: Ratio of imports to exports in the years 1996=0.85.
Let the exports in 1996=Rs.320 crores.
Then,272/x =0.85 implies x=272/.85 = 320.
Exports in 1996 = Rs.320 crores.
- e: The graph gives only the ratio of imports to exports for different years. To find the percentage increase in imports from 1997 to 1998, we require more details such as the value of imports or exports during these years. Hence, the data is inadequate to answer this question.
- d: The ratio of imports to exports for the years 1998 and 1999 are 1.25 and 1.40 respectively.
Let the exports in the year 1998 = Rs. x crores
Then, the exports in the year 1999=Rs(500-x) crores.
1.25=250/x implies x=250/1.25=200
Thus the exports in the year 1999=Rs. (500-200)crores=Rs.300 crores
Let the imports in the year 1999=Rs. y crores
Then, 1.4=y/300 implies y=(300*1.4)=420.
Imports in the year 1999=Rs.420 crores.
Ex.3.Study the following line-graph and answer the question based on it.
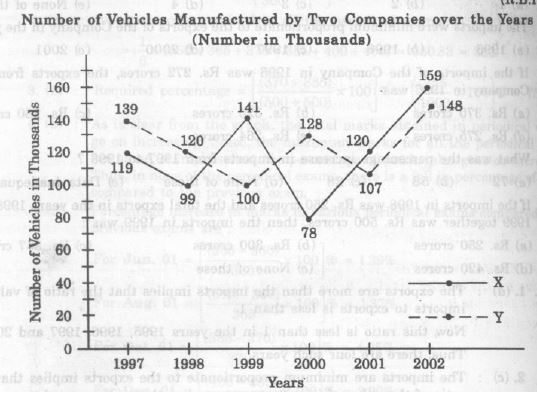
Number of vehicle Manufactured by Two Companies over the Years
(Numbers in thousands)
1.What is the difference between the total productions of the two Companies in the given years?
- 19000 b. 22000 c.26000 d.28000 e.29000
2.What is the difference between the numbers of vehicles manufactured by Company Y in 2000 and 2001?
a.50000 b.42000 c.33000 d.21000 e.13000
3.What is the average number of vehicles manufactured by Company X over the given period? (rounded off to the nearest integer)
a.119333 b.113666 c.112778 d.111223 e. None of these
4.In which of the following years, the difference between the productions of Companies X and Y was the maximum among the given years?
a.1997 b.1998 c.1999 d.2000 e.2001
5.The production of Company Y in 2000 was approximately what percent of the production of Company X in the same year?
a.173. b.164 c.132 d.97 e.61
Sol: From the line-graph it is clear that the productions of Company X in the years 1997,1998,1999,2000,2001 and 2002 are 119000,99000,141000,78000,120000and 159000 respectively and those of Company Y are 139000,120000,100000,128000,107000 and 148000 respectively.
- (c) : Total production of Company X from 1997 to 2002
= 119000+99000+141000+78000+120000+159000 = 716000
and total production of Company Y from 1997 to 2002
=139000+120000+100000+128000+107000+148000=742000
Difference=742000-716000=26000.
- (d) : Require difference = 128000-107000 = 21000.
- (a) : Average number of vehicles manufactured by Company X
= (91/6)* (119000 + 99000 + 141000 + 78000 + 120000 + 159000) = 119333.
- (d) : The difference between the production of Companies X and Y in various years are.
For 1997 = (139000 – 119000) = 20000;
For 1998 = (120000 – 99000) = 21000;
For 1999 = (141000 – 100000) = 41000;
For 2000 = (128000 – 78000) = 50000;
For 2001 = (120000 – 107000) = 13000;
For 2003 = (159000 – 148000) = 11000;
Clearly, maximum difference was in 2000.
- (b) : Required percentage = [( 128000/78000)* 100] % = 164 %.
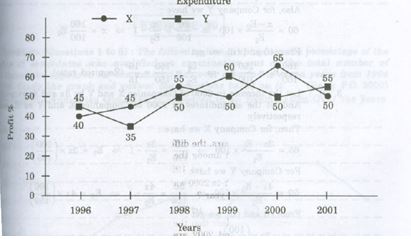
Ex. 4. The following line-graph gives the percent profit earned by two Companies X and Y during the period 1996 – 2001. Study the line – graph and answer the questions that are based on on it.
Percentage Profit Earned by Two Companies X and Y over the Given years
% profit/ loss = [(Income – Expenditure) / Expenditure] * 100
- If the expenditure of Company Y in 1997 was Rs. 220 crores, what was its income in 1997?
(a). Rs. 312 crores (b). Rs. 297 crores (c) Rs. 283 crores (d) Rs. 275 crores (e)Rs.261 crores
2.If the incomes of the two companies were equal in 1999,then what was the ratio of expenditure of Company X to that of company Y in 1999 ?
(a) 6:5 (b) 5:6 (c) 11:6 (d) 16:15 (e) 15:16
3.The incomes of the companies X and Y in 2000 were in the ratio of 3:4 respectively.What was the respective ratio of their expenditures in 2000?
(a) 7:22 (b) 14:19 (c) 15:22 (d)27:35 (e) 33:40
4.If the expenditure ofcompanies X and Y in 1996 were equal and the total income of the two companies in 1996 was Rs.342 crores, what was the total profit of the twocompanies together in 1996 ? (Profit = Income – Expenditure)
- 240crores (b) Rs.171crores (c) Rs.120crores (d) Rs.102crores (e)None of these.
5.The expenditure ofcompany X in the year 1998 was Rs.200 crores and the income Company X in 1998 was the same as its expenditure in 2001 was:
- 465crores (b)Rs.385crores (c)Rs.295crores (d)Rs.255crores
Sol.1.(b) : Profit percent ofcompany Y in 1997=35.
Let the income of company Y in 1997 be Rs.x crores
Then,35 = x-220 X 100 Þ x =297
220
\Income of company Yin 1997 = Rs.297crores
2.(d): Let the incomes of the twocompanies X and Yin 1999 be Rs.x and let the Expenditures of companies X and Y in 1999 be E1 and E2 respectively
Then, for Company X we have:
50= x-E1 x 100 Þ 50 = x -1 Þ x = 150 E1
E1 100 E1 100
Also, for the Company Y we have:
60 = x-E2 *100 =>60 = x -1 =>x =160 E2
E2 100 E2 100
From (i) and (ii),we get
150 E1 =160 E2 =>E1=160 =16(Required ratio)
100 100 E2 150 15
3.(c):Let the incomes in 2000 of companies X and Y be 3x and 4x respectively.And let the expenditure in 2000 of companies X and Y be E1 and E2 respectively.
Then, for company X we have:
65=3x-E1 *100 =>65 = 3x -1 =>E1=3x *(100)
E1 100 E1 165
For company Y we have:
50 =4x-E2 *100 => 50 = 4x -1 =>E2 = 4x* (100)
E2 100 E2 150
From (i)and(ii) we get:
E1 = 3x*(100/165) =3* 150 =15(Required ratio)
E2 4x*(100/150) 4*165 22
4.(d):Let the expenditures of each of the Companies X and Y in 1996 be Rs.xcrores.And let the income of Company X in 1996 be Rs.zcrores so that the income of Company Y in 1996 =Rs.(342-z)crores.
Then,for company X we have:
40= z-x *100 => 40 = z -1 => x = 100z
x 100 x 140
Also for company Y we have:
45= (342-z)-x *100 => 45 = (342-z) -1 =>x = (342 –z)* 100
x 100 x 145
From(i)and (ii) we get:
100z = (342-z) *100 =>z = 168
- 145
Substituting z=168 in (i),we get: x=120
\ Total expenditure of companies X and Y in 1996=2x=Rs.240crores.
Total income of companies X and Y in 1996=Rs.342 crores.
\Total profit =Rs.(342-240)crores =Rs.102 crores
5.(a): Let the income of company X in 1998 be Rs.x crores.
Then,55= x-200 *100 => x = 310.
200
\Expenditure of Company X in 2001= Income of company X in 1998 = Rs.310crores
Let the income of company X in 2001 be Rs.z crores
Then,50 = z-310 *100 =>z = 465.
310
\Income of company X in 2001 = Rs.465 crores.
The “Quantitative Aptitude for Competitive Examinations” by R.S. Aggarwal is a comprehensive resource widely used by aspirants preparing for various competitive exams. The book encompasses a range of topics, including a dedicated section on Data Interpretation, which covers Line Graphs extensively.
Contents Related to Line Graphs:
- Section II: Data Interpretation
- Tabulation
- Bar Graphs
- Pie Charts
- Line Graphs
For a preview of the book, including the section on Line Graphs, you can visit the Internet Archive:
Please note that while this link provides a sample of the book, accessing the complete content may require purchasing the book through authorized sellers or platforms. It’s essential to ensure that any resources you use are obtained legally and ethically.
For comprehensive study and practice, it’s recommended to acquire the latest edition of the book, which is available through various bookstores and online retailers. This will ensure you have access to all the topics, including detailed explanations and practice questions on Line Graphs.
RS Aggarwal Quantitative Aptitude PDF Free Download: LINE-GRAPHS